AAP Phototherapy Chart Calculator
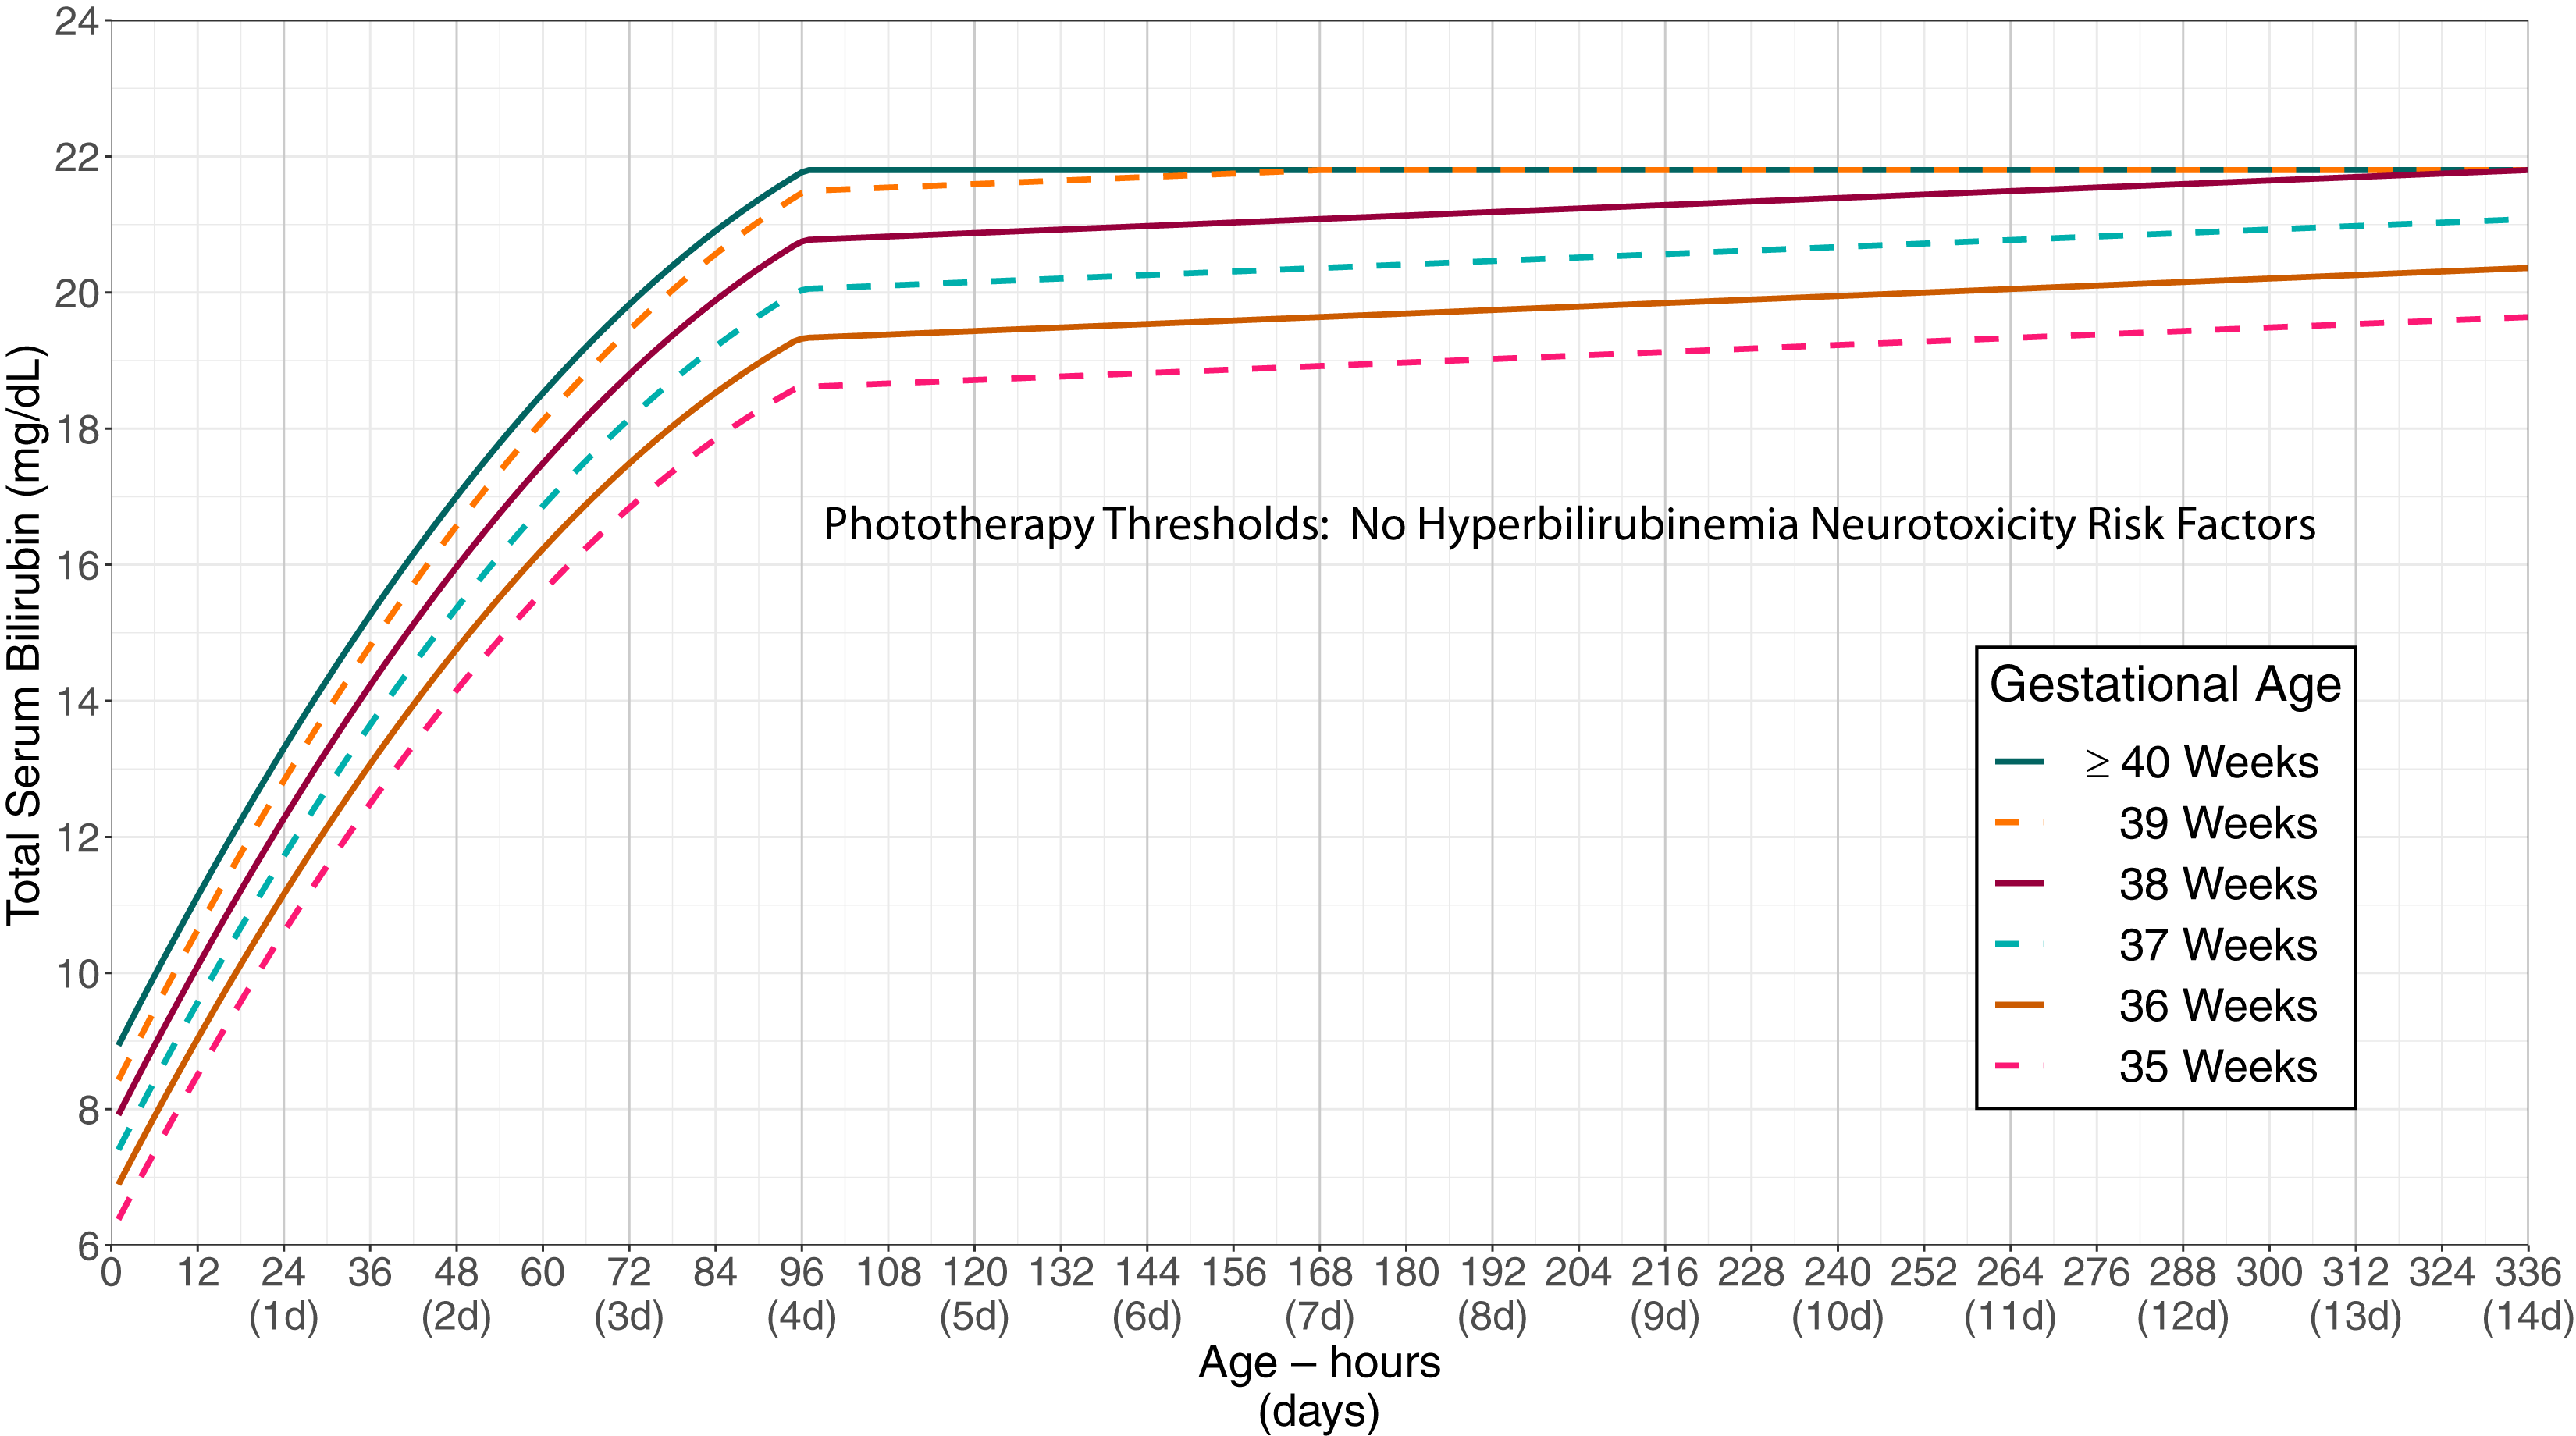
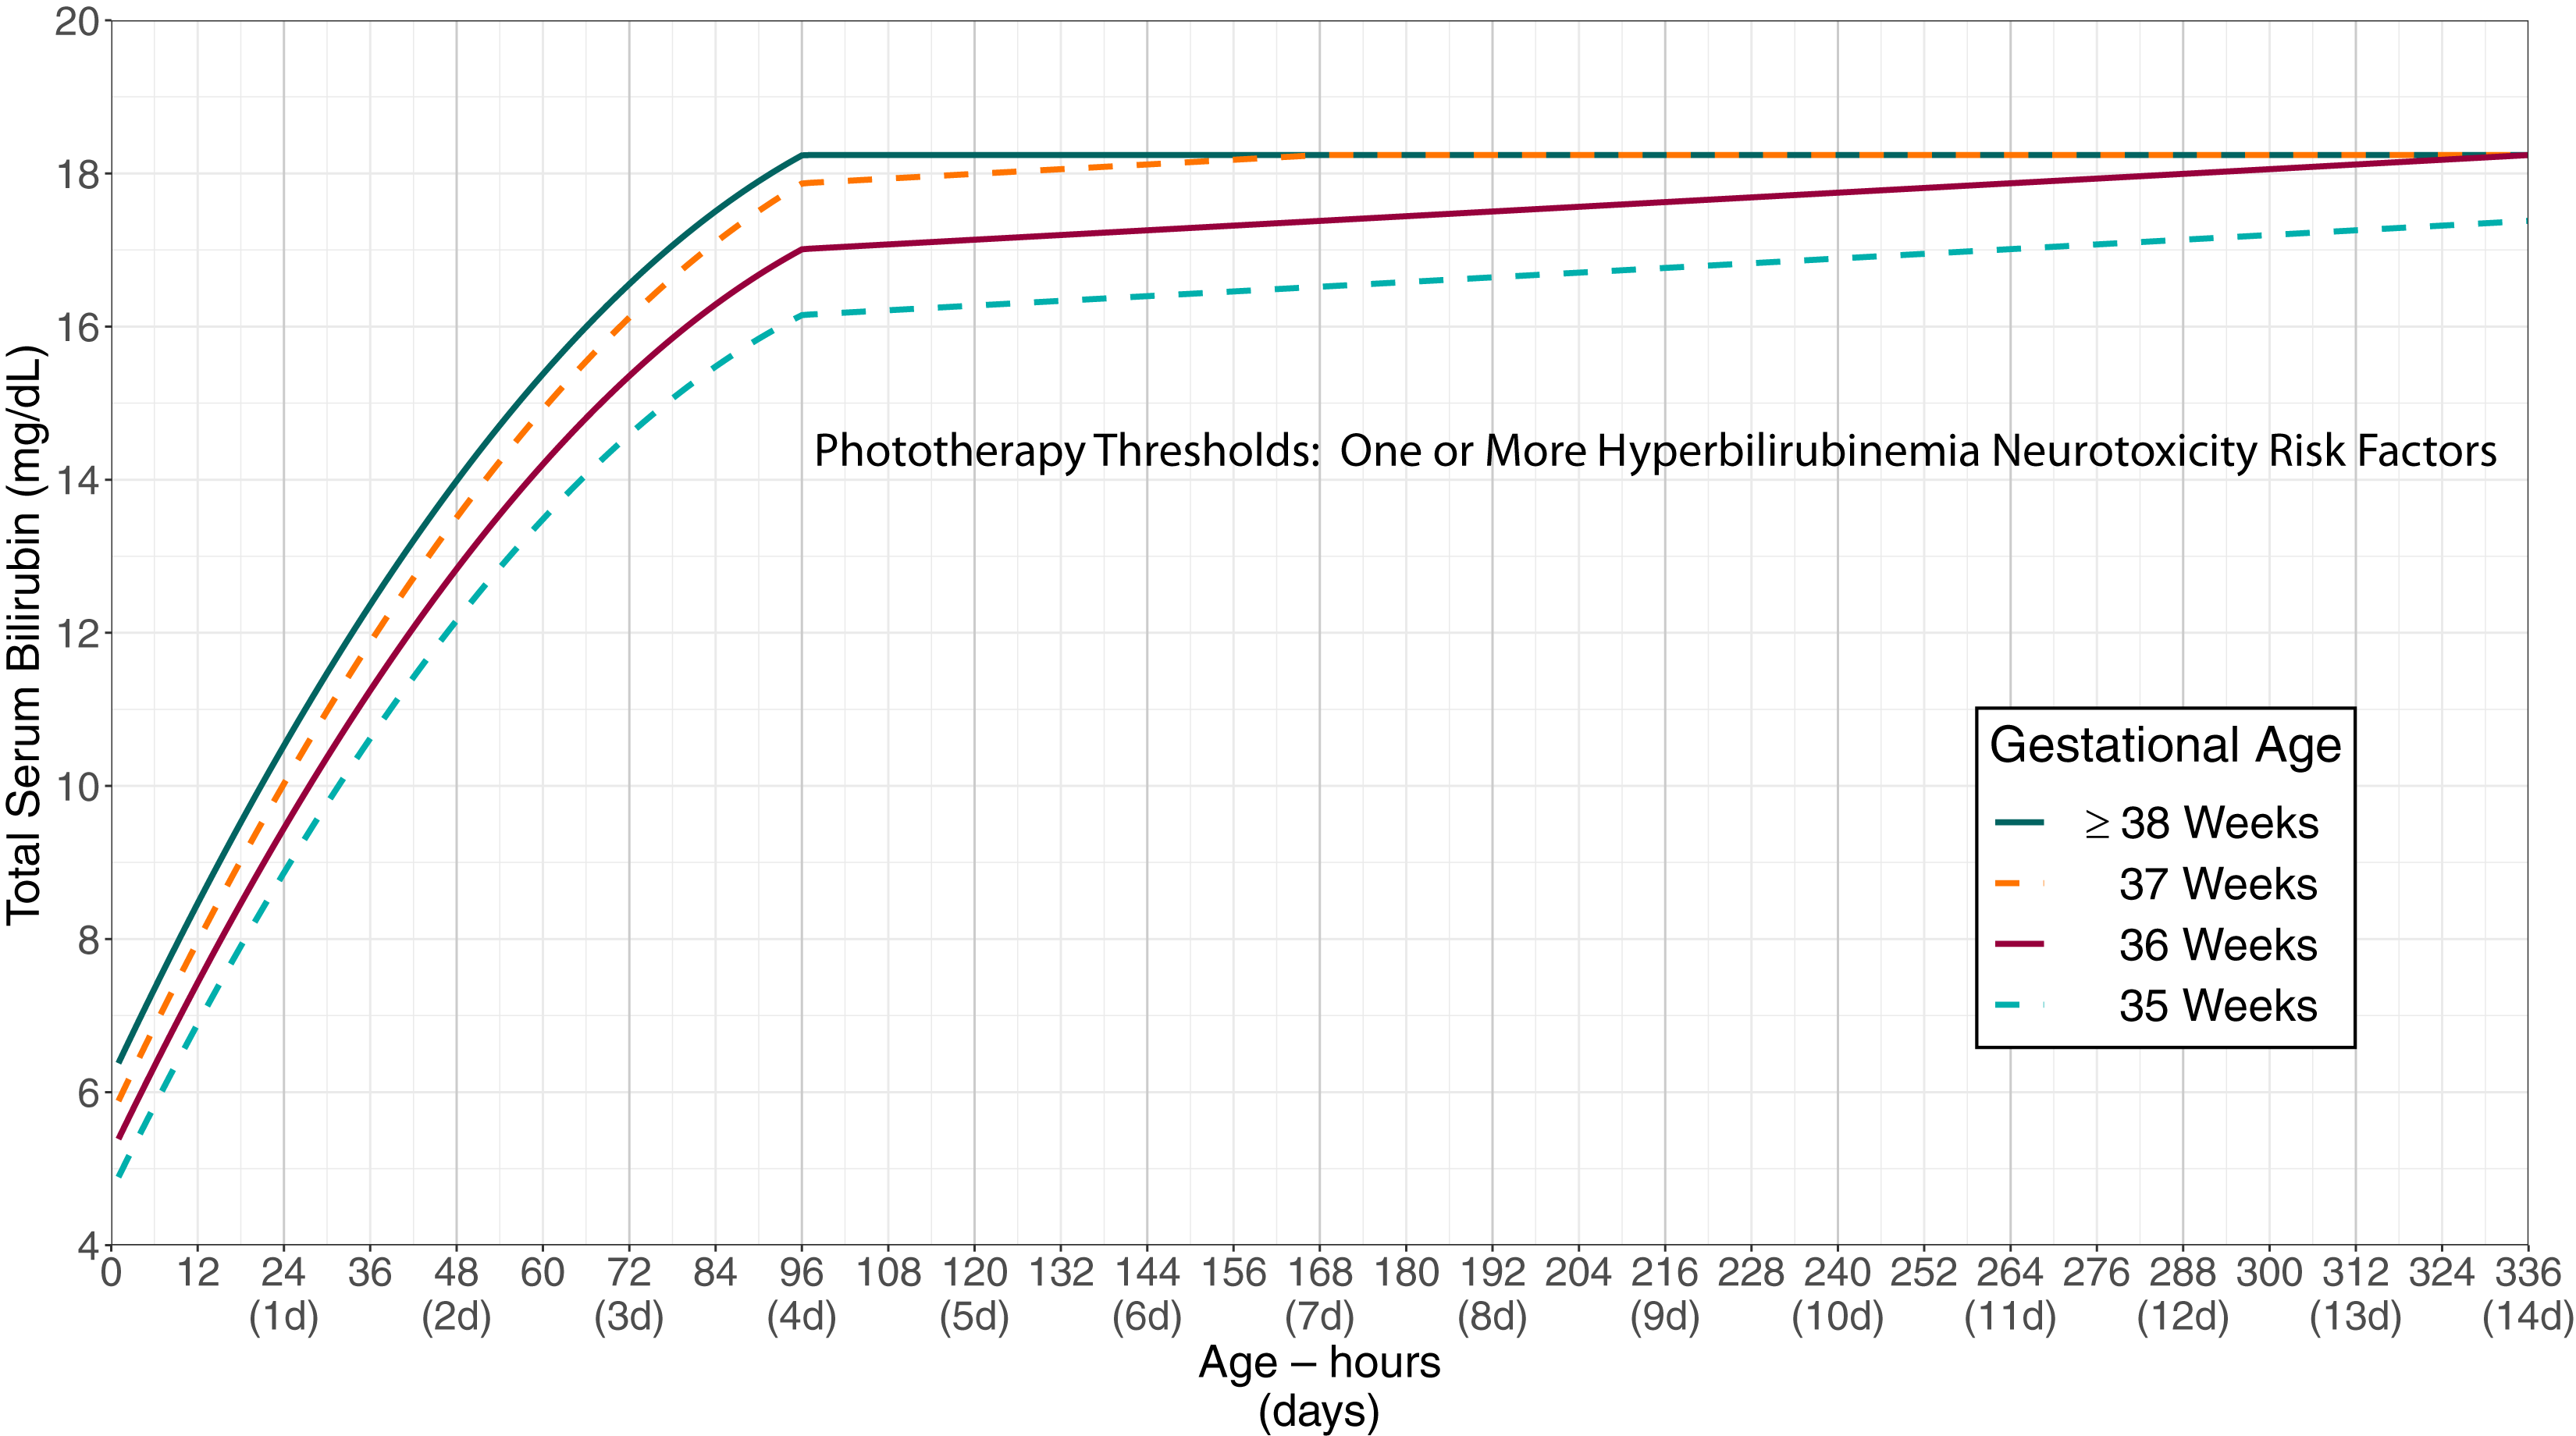
Interactive AAP 2022 bilirubin phototherapy chart and exchange thresholds by age in hours. Based on the 2022 American Academy of Pediatrics clinical practice guideline and adapted for local use by Johns Hopkins All Children's Hospital neonatal hyperbilirubinemia clinical pathway (June 2023).
- Lower gestational age (risk increases with each week <40)
- Jaundice within the first 24 hours after birth
- Predischarge TcB/TSB close to the phototherapy threshold
- Hemolysis with rapid bilirubin rise (>0.3 mg/dL/h in first 24 h or >0.2 mg/dL/h thereafter)
- Phototherapy before discharge
- Parent or sibling required phototherapy/exchange
- Family history/genetic ancestry suggesting inherited RBC disorders (including G6PD deficiency)
- Exclusive breastfeeding with suboptimal intake
- Scalp hematoma or significant bruising
- Down syndrome
- Macrosomic infant of a diabetic mother
- Gestational age <38 weeks (risk increases with prematurity)
- Albumin <3.0 g/dL
- Isoimmune hemolytic disease, G6PD deficiency, or other hemolytic conditions
- Sepsis
- Significant clinical instability within the previous 24 hours
| Gestation (weeks) | Phototherapy (mg/dL) | Exchange transfusion (mg/dL) | ||||||
|---|---|---|---|---|---|---|---|---|
| 12 h | 24 h | 48 h | 72 h+ | 12 h | 24 h | 48 h | 72 h+ | |
| 23 | 3.2 | 4.0 | 5.9 | 7.6 | 6.1 | 7.6 | 10.5 | 13.5 |
| 24 | 3.2 | 4.4 | 6.4 | 8.2 | 6.1 | 7.9 | 11.1 | 14.0 |
| 25 | 3.5 | 4.7 | 6.7 | 8.8 | 6.4 | 8.2 | 11.4 | 14.6 |
| 26 | 3.5 | 4.7 | 7.0 | 9.4 | 6.4 | 8.2 | 11.7 | 15.2 |
| 27 | 3.6 | 5.0 | 7.3 | 10.0 | 6.5 | 8.5 | 12.0 | 15.8 |
| 28 | 3.8 | 5.0 | 7.6 | 10.5 | 6.7 | 8.5 | 12.3 | 16.4 |
| 29 | 3.8 | 5.3 | 8.2 | 11.1 | 6.7 | 8.8 | 12.9 | 17.0 |
| 30 | 4.0 | 5.3 | 8.5 | 11.7 | 6.9 | 8.8 | 13.2 | 17.6 |
| 31 | 4.1 | 5.6 | 9.0 | 12.3 | 7.0 | 9.1 | 13.7 | 18.1 |
| 32 | 4.1 | 5.9 | 9.4 | 12.9 | 7.0 | 9.4 | 14.0 | 18.7 |
| 33 | 4.2 | 6.1 | 9.9 | 13.5 | 7.1 | 9.7 | 14.6 | 19.3 |
| 34 | 4.2 | 6.1 | 10.2 | 14.0 | 7.1 | 9.7 | 14.9 | 19.9 |
Plot a reference point
Chart options
| Hours | Days | Phototherapy (µmol/L) | Phototherapy (mg/dL) | Exchange (µmol/L) | Exchange (mg/dL) | ≥38w Phototherapy (µmol/L) | ≥38w Phototherapy (mg/dL) | ≥38w Exchange (µmol/L) | ≥38w Exchange (mg/dL) |
|---|---|---|---|---|---|---|---|---|---|
| 0 | 0.00 | 40.0 | 2.34 | 80.0 | 4.68 | 100.0 | 5.85 | 100.0 | 5.85 |
| 6 | 0.25 | 59.2 | 3.46 | 104.2 | 6.09 | 125.0 | 7.31 | 150.0 | 8.77 |
| 12 | 0.50 | 78.3 | 4.58 | 128.3 | 7.50 | 150.0 | 8.77 | 200.0 | 11.70 |
| 18 | 0.75 | 97.5 | 5.70 | 152.5 | 8.92 | 175.0 | 10.23 | 250.0 | 14.62 |
| 24 | 1.00 | 116.7 | 6.82 | 176.7 | 10.33 | 200.0 | 11.70 | 300.0 | 17.54 |
| 30 | 1.25 | 135.8 | 7.94 | 200.8 | 11.74 | 212.0 | 12.40 | 350.0 | 20.47 |
| 36 | 1.50 | 155.0 | 9.06 | 225.0 | 13.16 | 225.0 | 13.16 | 400.0 | 23.39 |
| 42 | 1.75 | 174.2 | 10.19 | 249.2 | 14.57 | 237.0 | 13.86 | 450.0 | 26.32 |
| 48 | 2.00 | 193.3 | 11.31 | 273.3 | 15.98 | 250.0 | 14.62 | 450.0 | 26.32 |
| 54 | 2.25 | 212.5 | 12.43 | 297.5 | 17.40 | 262.0 | 15.32 | 450.0 | 26.32 |
| 60 | 2.50 | 231.7 | 13.55 | 321.7 | 18.81 | 275.0 | 16.08 | 450.0 | 26.32 |
| 66 | 2.75 | 250.8 | 14.67 | 345.8 | 20.22 | 287.0 | 16.78 | 450.0 | 26.32 |
| 72 | 3.00 | 270.0 | 15.79 | 370.0 | 21.64 | 300.0 | 17.54 | 450.0 | 26.32 |
| 78 | 3.25 | 270.0 | 15.79 | 370.0 | 21.64 | 312.0 | 18.25 | 450.0 | 26.32 |
| 84 | 3.50 | 270.0 | 15.79 | 370.0 | 21.64 | 325.0 | 19.01 | 450.0 | 26.32 |
| 90 | 3.75 | 270.0 | 15.79 | 370.0 | 21.64 | 337.0 | 19.71 | 450.0 | 26.32 |
| 96 | 4.00 | 270.0 | 15.79 | 370.0 | 21.64 | 350.0 | 20.47 | 450.0 | 26.32 |
| 102 | 4.25 | 270.0 | 15.79 | 370.0 | 21.64 | 350.0 | 20.47 | 450.0 | 26.32 |
| 108 | 4.50 | 270.0 | 15.79 | 370.0 | 21.64 | 350.0 | 20.47 | 450.0 | 26.32 |
| 114 | 4.75 | 270.0 | 15.79 | 370.0 | 21.64 | 350.0 | 20.47 | 450.0 | 26.32 |
| 120 | 5.00 | 270.0 | 15.79 | 370.0 | 21.64 | 350.0 | 20.47 | 450.0 | 26.32 |
| 126 | 5.25 | 270.0 | 15.79 | 370.0 | 21.64 | 350.0 | 20.47 | 450.0 | 26.32 |
| 132 | 5.50 | 270.0 | 15.79 | 370.0 | 21.64 | 350.0 | 20.47 | 450.0 | 26.32 |
| 138 | 5.75 | 270.0 | 15.79 | 370.0 | 21.64 | 350.0 | 20.47 | 450.0 | 26.32 |
| 144 | 6.00 | 270.0 | 15.79 | 370.0 | 21.64 | 350.0 | 20.47 | 450.0 | 26.32 |
| 150 | 6.25 | 270.0 | 15.79 | 370.0 | 21.64 | 350.0 | 20.47 | 450.0 | 26.32 |
| 156 | 6.50 | 270.0 | 15.79 | 370.0 | 21.64 | 350.0 | 20.47 | 450.0 | 26.32 |
| 162 | 6.75 | 270.0 | 15.79 | 370.0 | 21.64 | 350.0 | 20.47 | 450.0 | 26.32 |
| 168 | 7.00 | 270.0 | 15.79 | 370.0 | 21.64 | 350.0 | 20.47 | 450.0 | 26.32 |
| 174 | 7.25 | 270.0 | 15.79 | 370.0 | 21.64 | 350.0 | 20.47 | 450.0 | 26.32 |
| 180 | 7.50 | 270.0 | 15.79 | 370.0 | 21.64 | 350.0 | 20.47 | 450.0 | 26.32 |
| 186 | 7.75 | 270.0 | 15.79 | 370.0 | 21.64 | 350.0 | 20.47 | 450.0 | 26.32 |
| 192 | 8.00 | 270.0 | 15.79 | 370.0 | 21.64 | 350.0 | 20.47 | 450.0 | 26.32 |
| 198 | 8.25 | 270.0 | 15.79 | 370.0 | 21.64 | 350.0 | 20.47 | 450.0 | 26.32 |
| 204 | 8.50 | 270.0 | 15.79 | 370.0 | 21.64 | 350.0 | 20.47 | 450.0 | 26.32 |
| 210 | 8.75 | 270.0 | 15.79 | 370.0 | 21.64 | 350.0 | 20.47 | 450.0 | 26.32 |
| 216 | 9.00 | 270.0 | 15.79 | 370.0 | 21.64 | 350.0 | 20.47 | 450.0 | 26.32 |
| 222 | 9.25 | 270.0 | 15.79 | 370.0 | 21.64 | 350.0 | 20.47 | 450.0 | 26.32 |
| 228 | 9.50 | 270.0 | 15.79 | 370.0 | 21.64 | 350.0 | 20.47 | 450.0 | 26.32 |
| 234 | 9.75 | 270.0 | 15.79 | 370.0 | 21.64 | 350.0 | 20.47 | 450.0 | 26.32 |
| 240 | 10.00 | 270.0 | 15.79 | 370.0 | 21.64 | 350.0 | 20.47 | 450.0 | 26.32 |
| 246 | 10.25 | 270.0 | 15.79 | 370.0 | 21.64 | 350.0 | 20.47 | 450.0 | 26.32 |
| 252 | 10.50 | 270.0 | 15.79 | 370.0 | 21.64 | 350.0 | 20.47 | 450.0 | 26.32 |
| 258 | 10.75 | 270.0 | 15.79 | 370.0 | 21.64 | 350.0 | 20.47 | 450.0 | 26.32 |
| 264 | 11.00 | 270.0 | 15.79 | 370.0 | 21.64 | 350.0 | 20.47 | 450.0 | 26.32 |
| 270 | 11.25 | 270.0 | 15.79 | 370.0 | 21.64 | 350.0 | 20.47 | 450.0 | 26.32 |
| 276 | 11.50 | 270.0 | 15.79 | 370.0 | 21.64 | 350.0 | 20.47 | 450.0 | 26.32 |
| 282 | 11.75 | 270.0 | 15.79 | 370.0 | 21.64 | 350.0 | 20.47 | 450.0 | 26.32 |
| 288 | 12.00 | 270.0 | 15.79 | 370.0 | 21.64 | 350.0 | 20.47 | 450.0 | 26.32 |
| 294 | 12.25 | 270.0 | 15.79 | 370.0 | 21.64 | 350.0 | 20.47 | 450.0 | 26.32 |
| 300 | 12.50 | 270.0 | 15.79 | 370.0 | 21.64 | 350.0 | 20.47 | 450.0 | 26.32 |
| 306 | 12.75 | 270.0 | 15.79 | 370.0 | 21.64 | 350.0 | 20.47 | 450.0 | 26.32 |
| 312 | 13.00 | 270.0 | 15.79 | 370.0 | 21.64 | 350.0 | 20.47 | 450.0 | 26.32 |
| 318 | 13.25 | 270.0 | 15.79 | 370.0 | 21.64 | 350.0 | 20.47 | 450.0 | 26.32 |
| 324 | 13.50 | 270.0 | 15.79 | 370.0 | 21.64 | 350.0 | 20.47 | 450.0 | 26.32 |
| 330 | 13.75 | 270.0 | 15.79 | 370.0 | 21.64 | 350.0 | 20.47 | 450.0 | 26.32 |
| 336 | 14.00 | 270.0 | 15.79 | 370.0 | 21.64 | 350.0 | 20.47 | 450.0 | 26.32 |
Sources and Reference Basis
This page is a clinical reference aid for neonatal jaundice threshold review. Use current local policy, infant-specific risk assessment, and confirm bilirubin units before treatment decisions.
- American Academy of Pediatrics 2022 Hyperbilirubinemia Guideline Primary guideline for management of hyperbilirubinemia in newborn infants 35 or more weeks of gestation.
- Johns Hopkins All Children Hospital Neonatal Hyperbilirubinemia Clinical Pathway Local pathway adaptation used here for bedside threshold display and charting.
Related Neonatal and Resident Tools
Frequently Asked Questions
What is the AAP phototherapy chart?
The AAP phototherapy chart shows bilirubin treatment thresholds by age in hours for newborns ≥35 weeks gestation, based on the 2022 AAP hyperbilirubinemia guideline. This calculator plots phototherapy and exchange cut-offs with and without neurotoxicity risk factors.
How do I use an AAP bilirubin chart at the bedside?
Enter or locate the infant age in hours, confirm gestational age and neurotoxicity risk factors, then compare the measured total bilirubin with the phototherapy and exchange thresholds on the chart.
Which infants do AAP phototherapy thresholds apply to?
The AAP 2022 guideline applies to newborns at least 35 weeks gestation. Thresholds vary by age in hours, gestation, and neurotoxicity risk factors.
What risk factors lower the phototherapy threshold?
Neurotoxicity risk factors include isoimmune hemolytic disease, G6PD deficiency or other hemolysis, instability or sepsis, albumin <3.0 g/dL, and clinically significant birth asphyxia or acidosis.